Debugging front-end applications with React Profiler
Usually, writing console.log or custom code to trace the root of bugs in React applications can be sufficient. However, when one works with a more extensive unfamiliar codebase, even tiny bugs can become challenging to tackle.
In this post, I would like to share my experience working with React Profiler, which not only enables a more efficient way of debugging applications but also detects the potential issues in applications that sometimes cannot even be noticed by the end-user.
Installing the profiler
The React Profiler comes as an extension*for all major browsers: Profiling Components with the DevTools Profiler.
Highlighting components render
One of the frequent problems in React development is managing the state of components and preventing them from extra unwanted re-renders. When working on some features, it is good to check whether components that are affected by our changes have not suddenly changed their lifecycle. The profiler comes with a great feature of highlighting every component render right in the viewport. To enable it, you have to have the DevTools open and select the Highlight updates when components render checkbox:
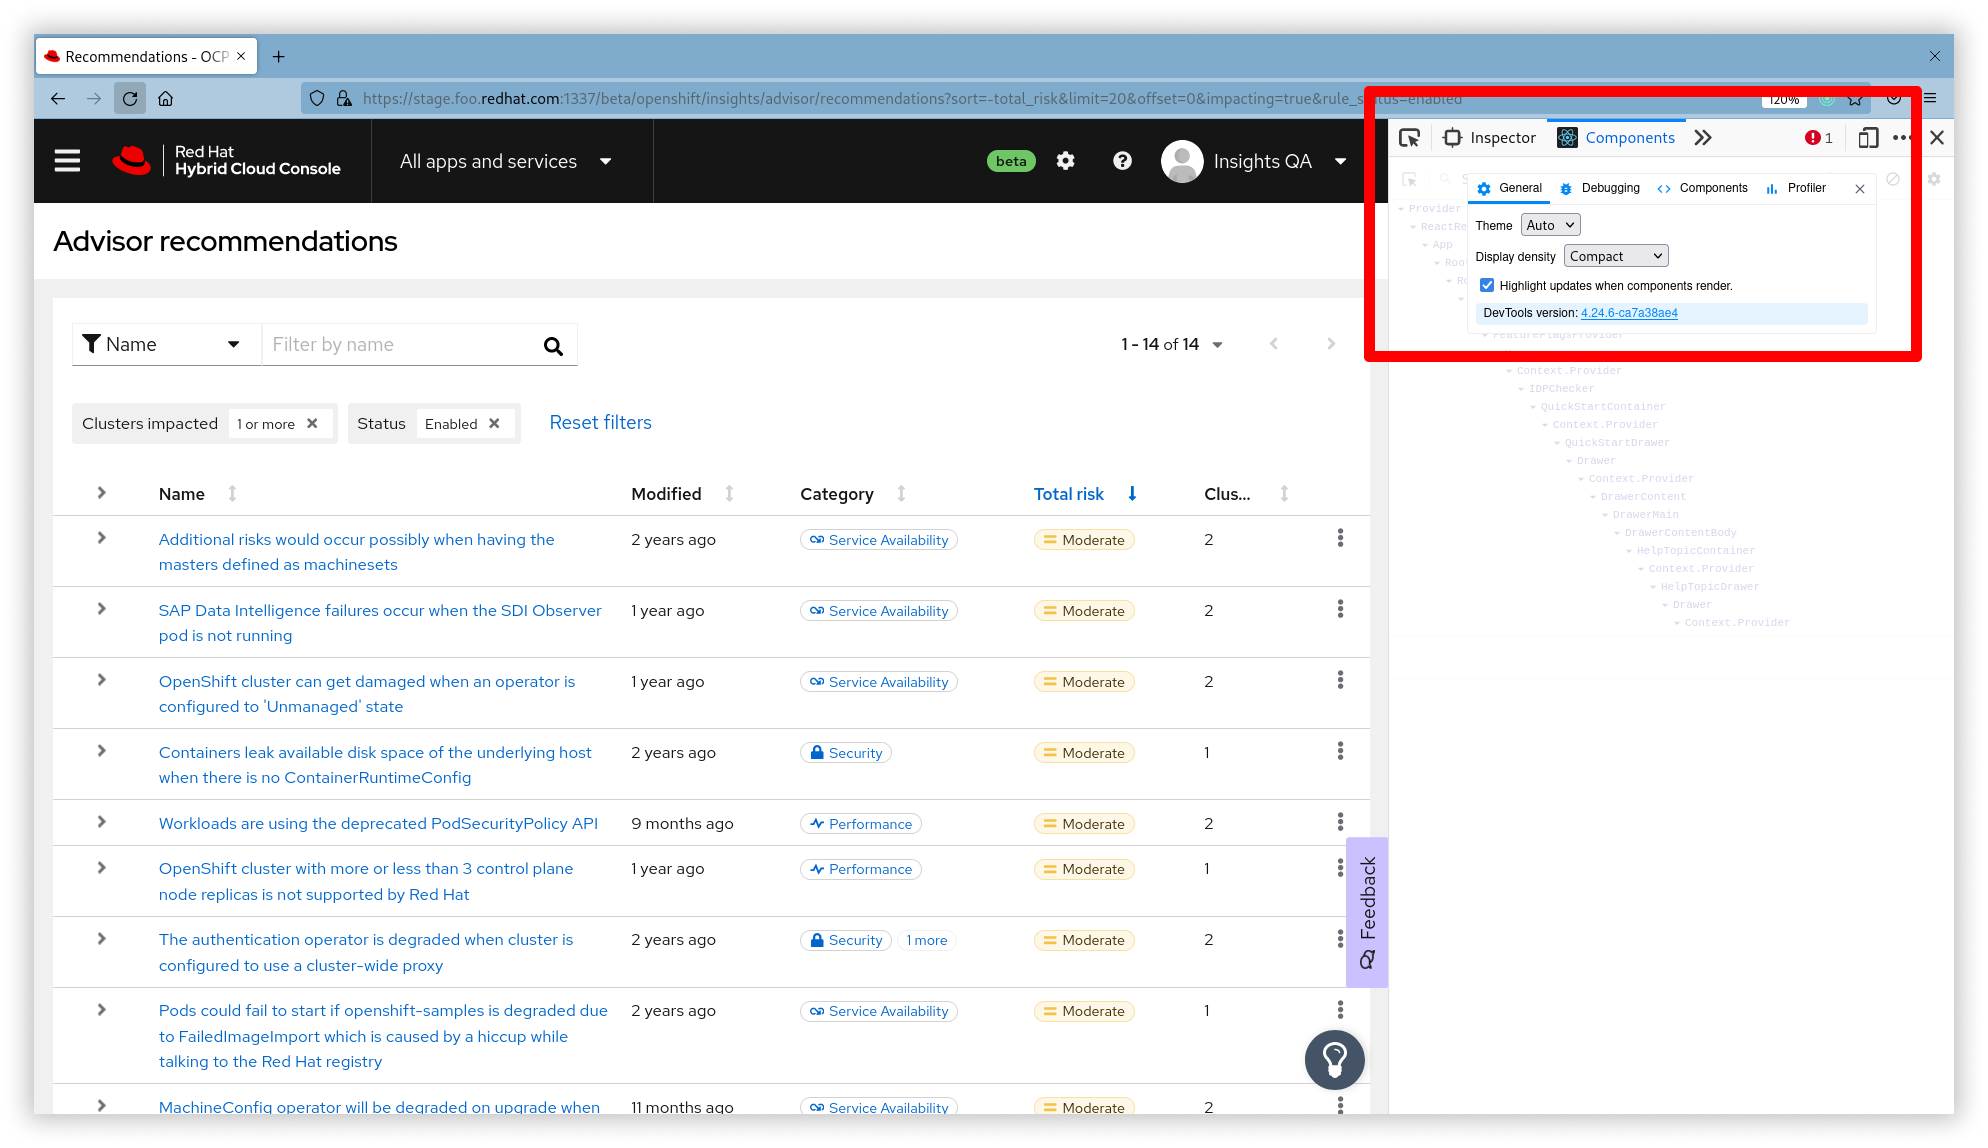
Once the feature is enabled, whenever you have your DevTools opened, you will see which components are re-rendered.
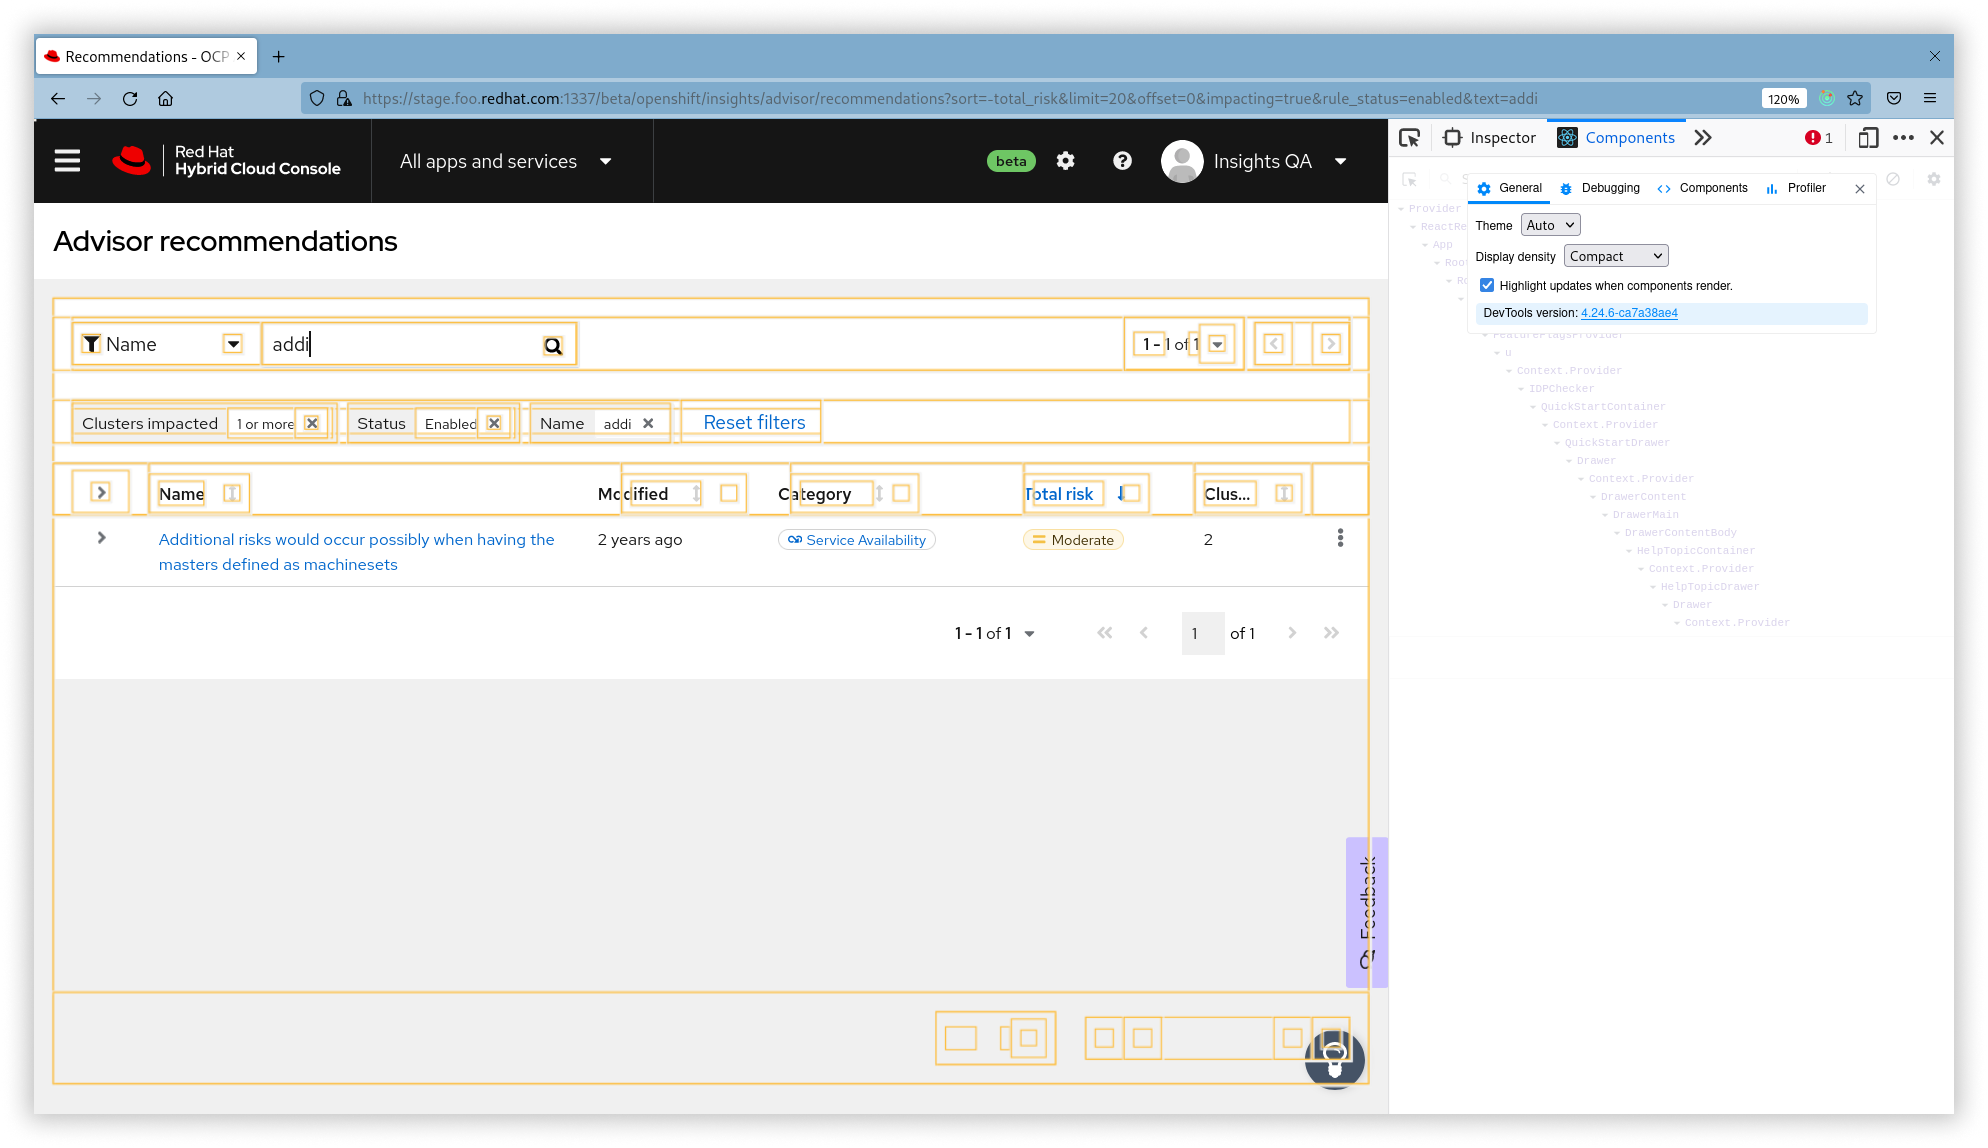
This really becomes handy if you, for example, play with table components and want to see that, for example, the page header (separate from the table component) is not re-rendered once you update the table filters — components that are not connected (do not share the common state or send properties) by the implementation:
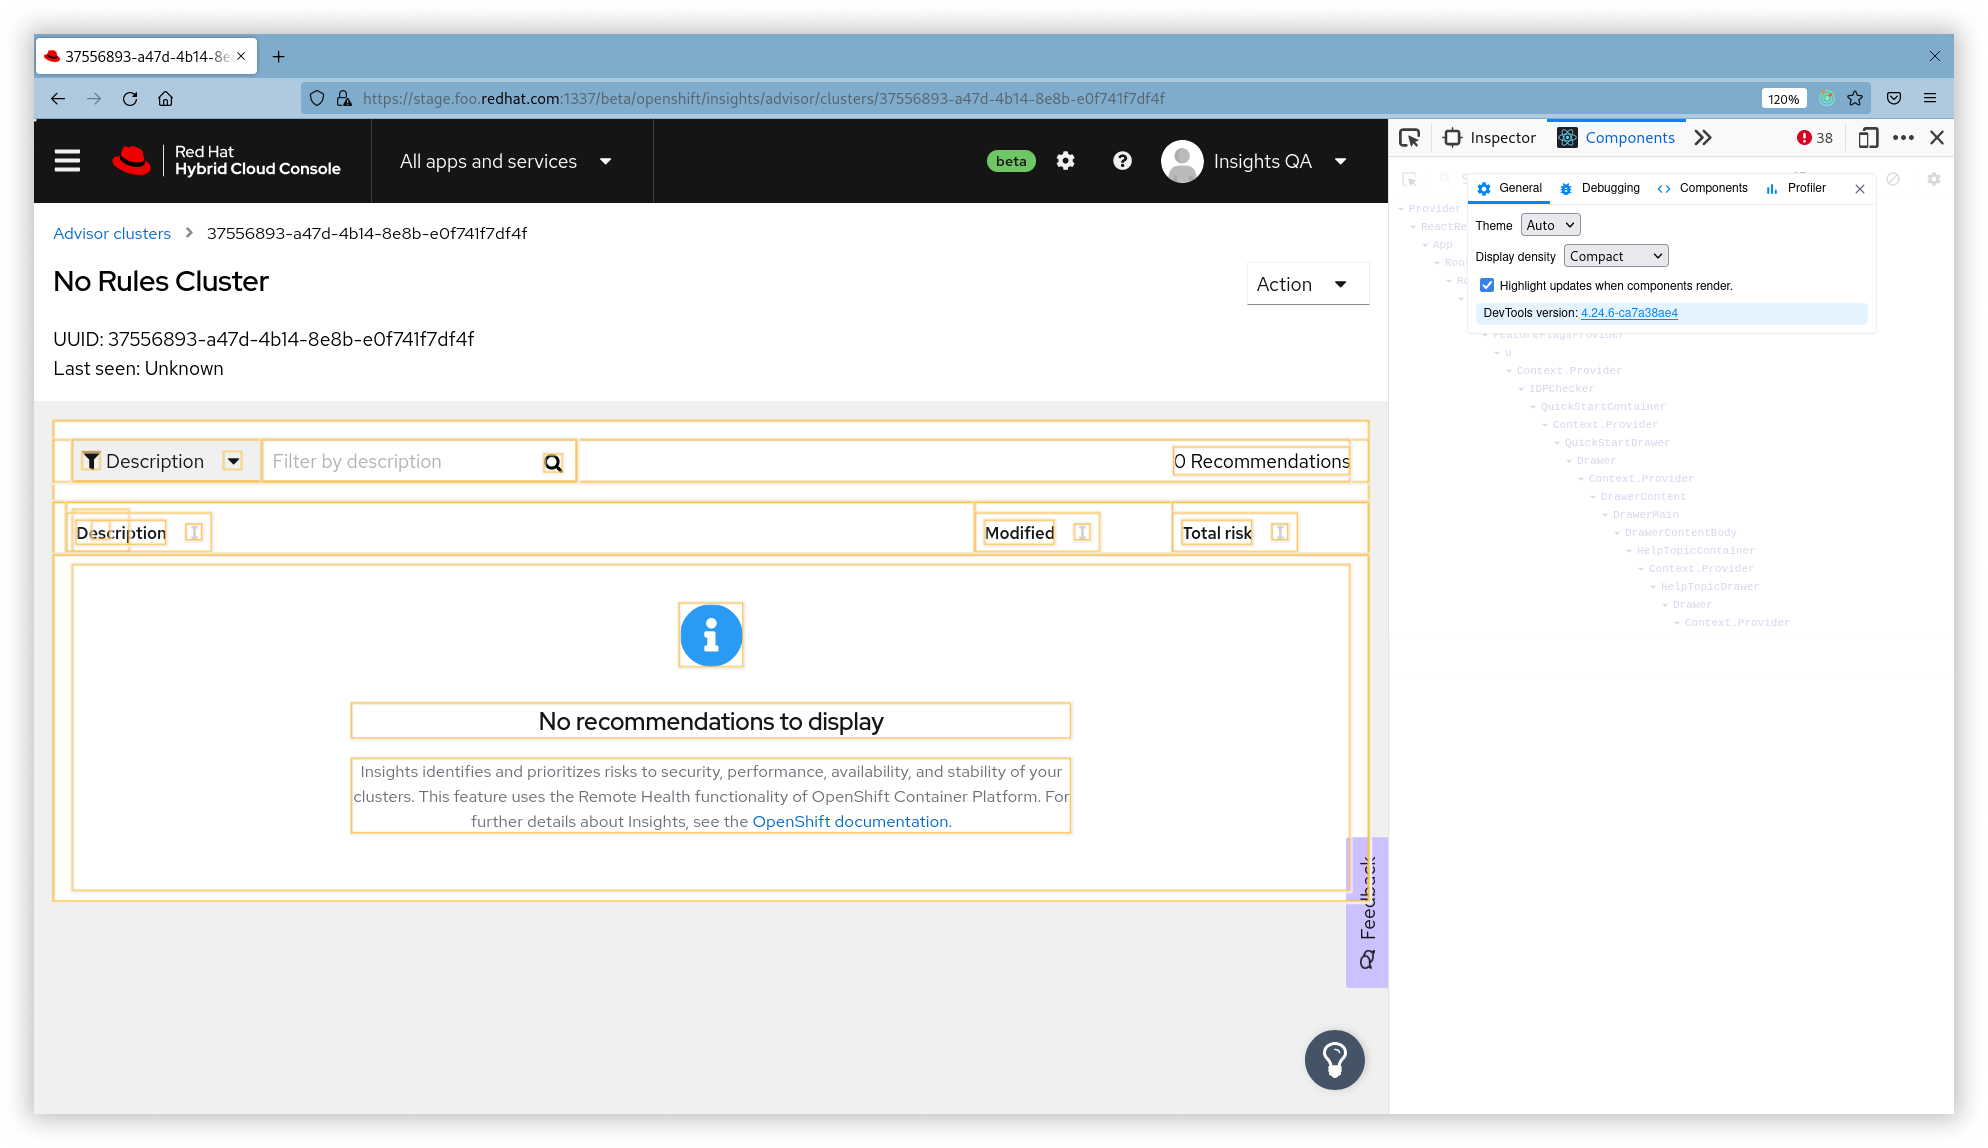
In my case, I have encountered one issue with an empty state in my application: the message has been re-rendering infinitely (the yellow outlines did not go away). This bug must have been there for a long time since, as an end-user, there is no real visible problem (maybe your laptop fan would notice it, though):
Profiling components
The profiler gives an excellent collection of tools that can quickly help trace the cause of component render.
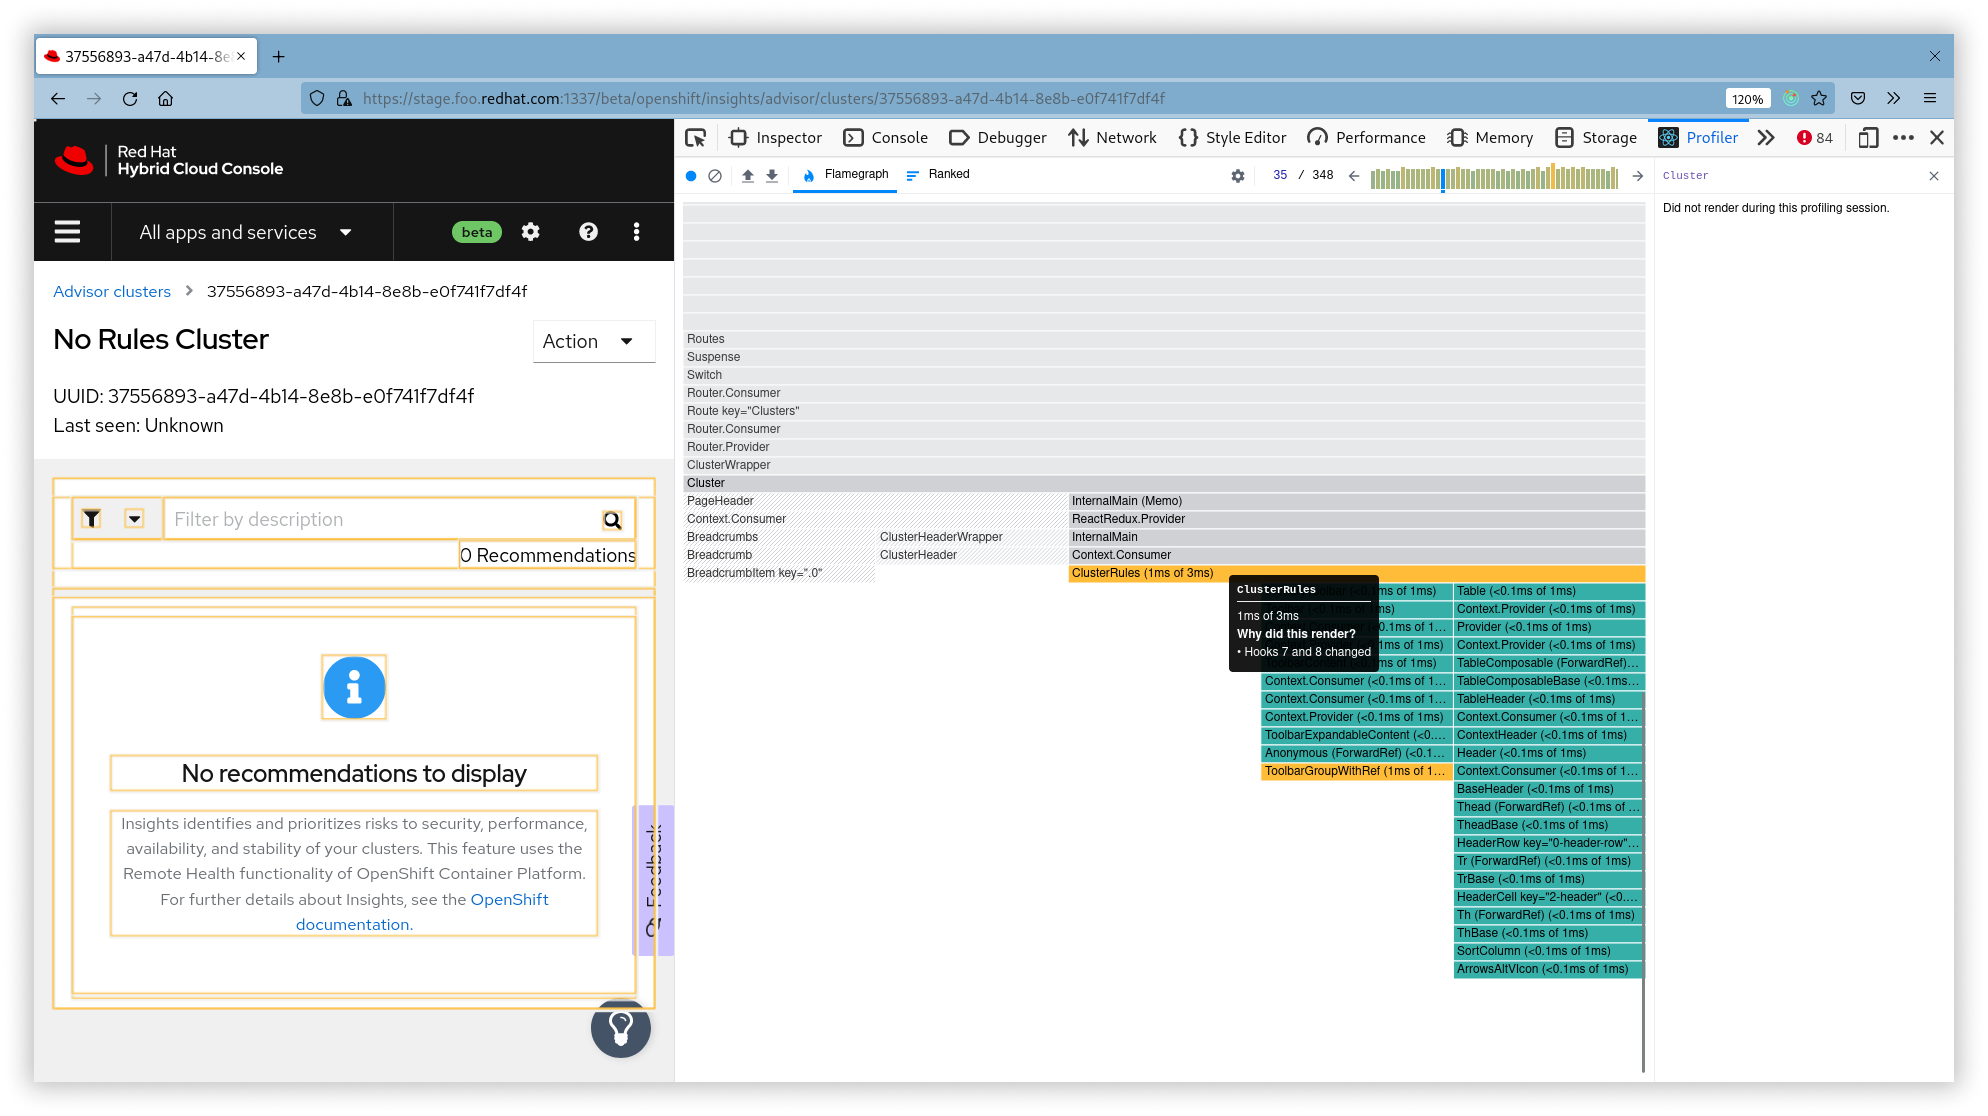
Having a page that you went to profile open, at DevTools, go to the Profiler section and click on a blue dot Start profiling. In our example, the time span of 1-2 seconds was enough to capture all the page components updates.
After the profiling is complete, it shows you a flamegraph divided by commits, where each commit tells how the React component tree was updated. The gray color means the component was not updated, whereas other colors tell the components were re-rendered. Hovering on the particular component will also tell you the reason for a re-render.
In our example, the reason was that we had two hooks changed:
Well, but what exactly Hooks 7 and 8 do really mean? To check this, we need to get back to the Components sections and take a look at this problematic component in the components tree. This will provide you with a nice summary of the state, properties, and other useful information:
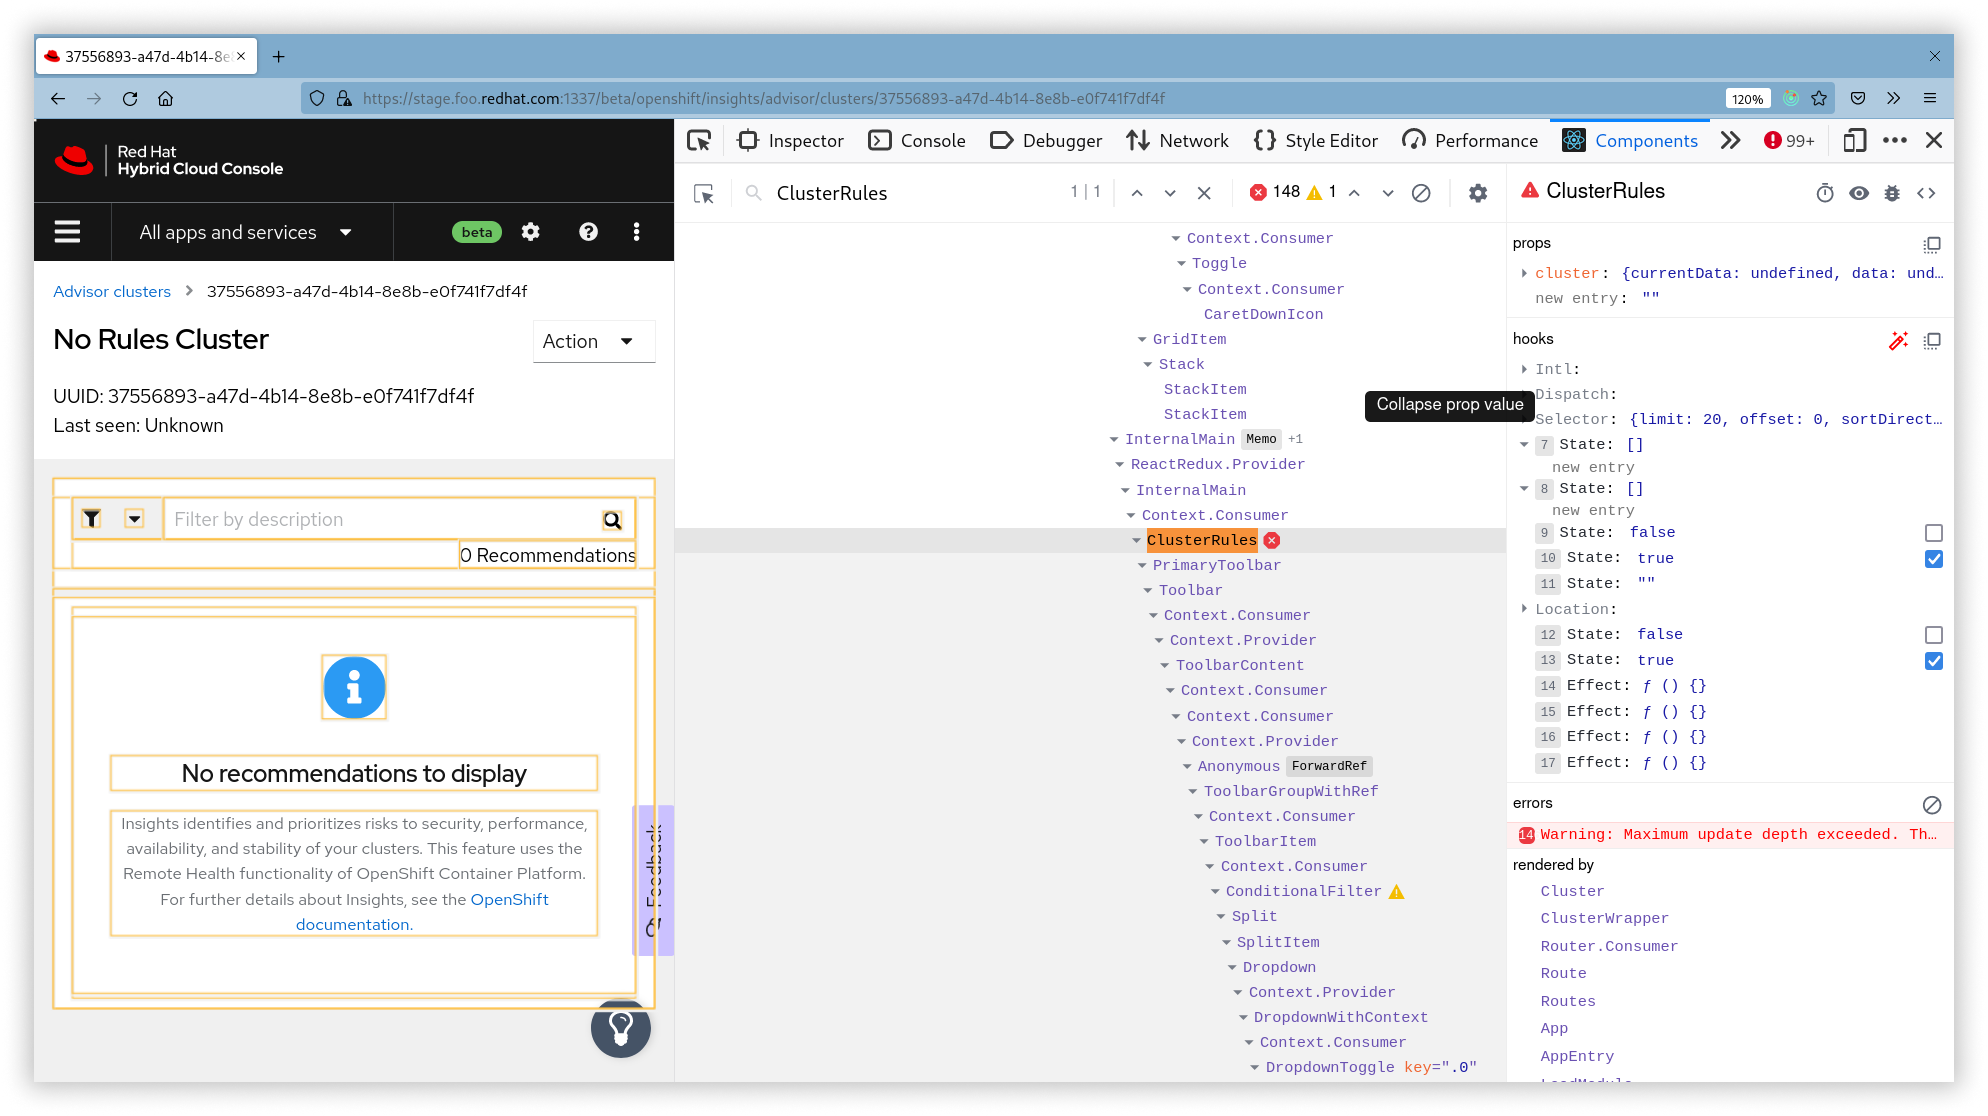
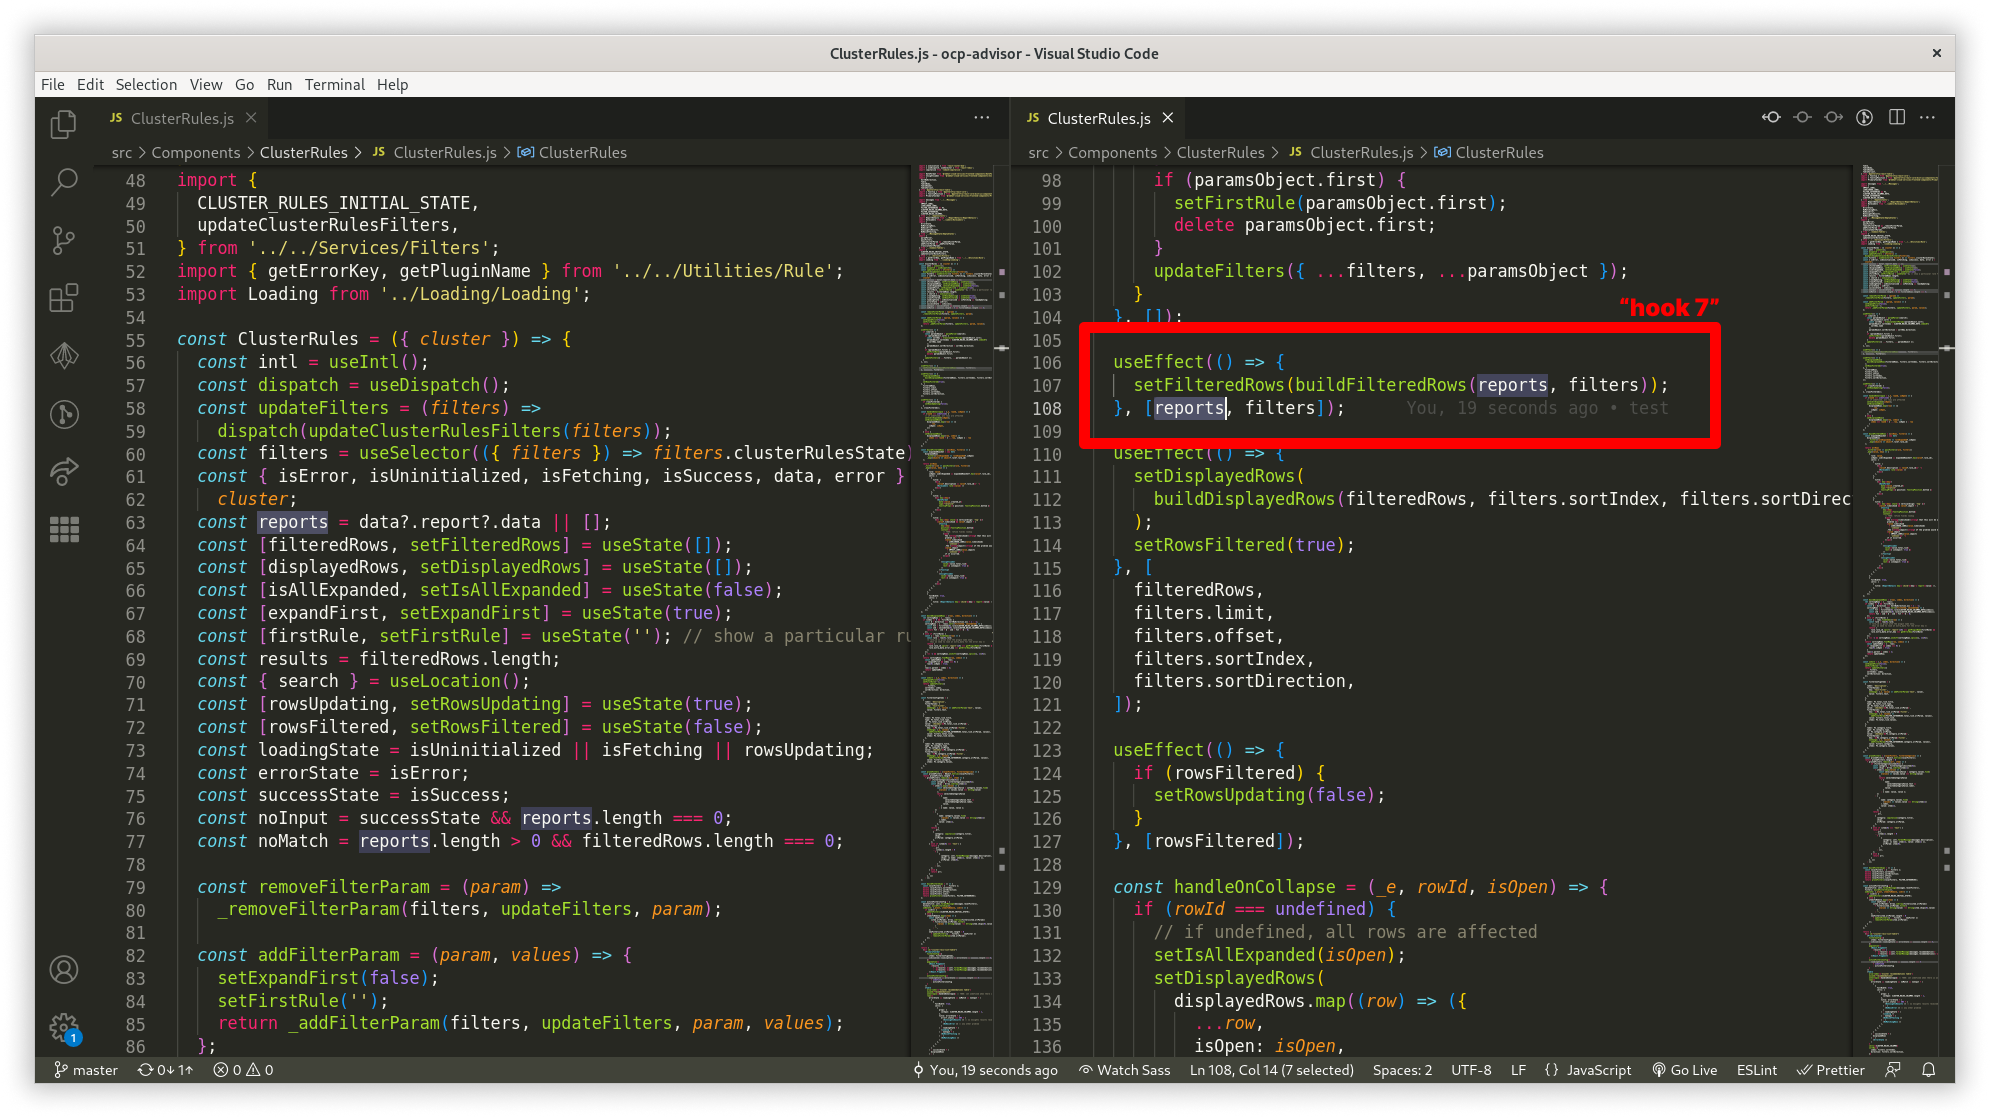
Still, this did not tell you much about what Hooks 7 and 8 mean. However, the order of hooks in the list is equal to how the hooks are written right in the source code of the components. Finally, looking at the code, I was able to identify the culprit and see that one of my useEffects relies on a state variable that is updated with every render and causing this render loop (in more detail, the problem here was that even though the array stayed empty ([]), in JavaScript, two empty arrays are considered non-equal by the strict equation.
This made the useEffect to be triggered again because of the “new value”:
Conclusion
React Profiler is definitely a great tool for debugging front-end applications. This lets you quickly identify the problems without even digging into the code editor and trying to tweak the component lifecycle.
In this article, I covered a little of what it actually can. Besides the profiler and component tree, it lets you measure performance or enhance the debugging mode.